ClassLoader & memory leaks: a Java love story
We’ve been experiencing very strange memory leak in our Java application servers at work: when deploying new version of a micro service, the JVM process was running out of memory and consequently crash leading to service outage.
After a bit of research, it looked like that these kind of errors were very common with this application server, especially when deploying application without restarting the server from time to time. The common fix was to restart the JVM process before putting in production, preventing any out of memory (but not the memory leak). That’s the short term “fix” we have chosen.
Coming mainly from a C/C++ background, I am accustomed to memory leak & memory profiling, I like to track these kind of errors and fix them. Therefore I wanted to deep dive into the details to learn more about Java internal mechanisms, and to determinate exactly where this leak happens to determinate if we can do something about it.
Get proof⌗
Record the heap memory⌗
We have suspected a specific library of being the memory leak source, the first thing to do was to make sure it was really the problem. To do so I have started a local instance of the application server, and deployed my WAR on it. I have then created a snapshot of the heap memory by using jmap.
jmap -dump:live,file=first.bin <pid>
Once I have the backup, I have started to re-deploy again my WAR file 7 times, without restarting the server.
And finally, I have created another heap snapshot with jmap.
Memory analysis⌗
Once I have these two heap snapshot, I have used the Eclipse memory analyzer to read the dump files. Here’s what I’ve found:
Size: 85.3 MB Classes: 23.5k Objects: 1.9m Class Loader: 436
There was 85.3 MB consumed. I personally think that it’s a lot, but it’s an application server after all, so it may be acceptable. Let’s move on the 2nd dump:
Size: 271.9 MB Classes: 35k Objects: 7.1m Class Loader: 1.4k
We can see that there is a clear problem. The memory consumption has tripled after 7 deploys. There’s a clear memory leak somewhere. It was time to act.
Understand the problem⌗
Now that I was convinced that there were a memory leak, I have used jmap to look into memory details, to understand what was consuming this much memory. The result was surprising:
371 instances of "*ClassLoader", loaded by "jdk.internal.loader.ClassLoaders$AppClassLoader @ 0x7e021a658" occupy 198,789,800 (??.??%) bytes.

Biggest instances:

* ClassLoader @ 0x7ef531c30 - 27,782,296 (9.74%) bytes.
* ClassLoader @ 0x7ee056470 - 27,781,552 (9.74%) bytes.
* ClassLoader @ 0x7e6658b18 - 27,781,208 (9.74%) bytes.
* ClassLoader @ 0x7ec60ab60 - 27,780,856 (9.74%) bytes.
* ClassLoader @ 0x7ef531cd8 - 27,780,032 (9.74%) bytes.
* ClassLoader @ 0x7ea3074b8 - 27,779,608 (9.74%) bytes.
* ClassLoader @ 0x7e31b53b0 - 27,200,584 (9.54%) byte
As you can see, there is a LOT of class loaders alive in the memory. And the biggest instances are the one from the previous deployments. They haven’t been cleaned up by the GC, explaining the memory leak: something is keeping these instances alive, along with all the data they contains.
How does GC work in Java⌗
Before searching the reason of the memory leak, it is really important to understand how Java garbage collection works. The algorithm used is called mark and sweep. Here’s how it works in a nutshell:
In Java there are special objects that cannot be garbage collected during application runtime. These objects are called GC roots. It is for example the actives threads, the static variables in the main class, the system class loader, the system classes, etc…
So, here’s how the algorithm proceed: it will build a sort of tree, starting from the GC roots, and will try to determine the path of every objects alive by referencing their usage. When the algorithm is finished, all objects that aren’t connected to a GC root will be candidate for garbage collection. The below schema explain it:
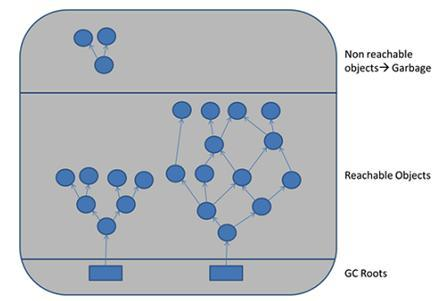
So, if our ClassLoader is still alive after deployment, it means that something in our application is “linking” it to a GC root, preventing any garbage collection. Now I know what to look for.
Track down the issue⌗
Hopefully, the eclipse memory analyzer has a really useful function called “path to GC roots” which show what are keeping a specific class alive. Here’s what I’ve found:
* ClassLoader @ 0x7ee056470
* * contextClassLoader io.github.classgraph.ScanResult$1
* * * [...]
* * * * hooks java.lang.ApplicationShutdownHooks @ 0x7e00863b8 (System class)
As you can see, the suspected library use the ClassGraph library internally to perform some operations on the class loader. This ClassGraph library has register a shutdown hook on the ApplicationShutdownHooks class (which is a system class, and therefore a GC root). ApplicationShutdownHooks is used to register special code to be executed upon JVM shutdown, and since our JVM is not restarting in our case (remember we are doing deployment without restart), the hook is never invoked and therefore still alive, keeping a reference to the ScanResult object, preventing it from being GC, thus preventing our whole class loader from being it too. We have our culprit!
Hopefully, ClassGraph is open sourced, so I have looked for reported issues, and found something interesting.
Someone has already reported the bug, which was solved in the release 4.8.51. But the bug is still there for us, I have then looked into the suspected library source code, and guess what? They are using 4.6.32. The bug is still there.
Conclusion⌗
This is already the end of our little journey through the Java memory mechanism. I have learn a lot about Java, and this was a really fun experience.
I have sent a pull request to our suspect library, and we are waiting for it to be merged, so that we can upgrade to the new version.
Happy hacking!